Reading Your Mock Exam Score Report
What the Report Contains
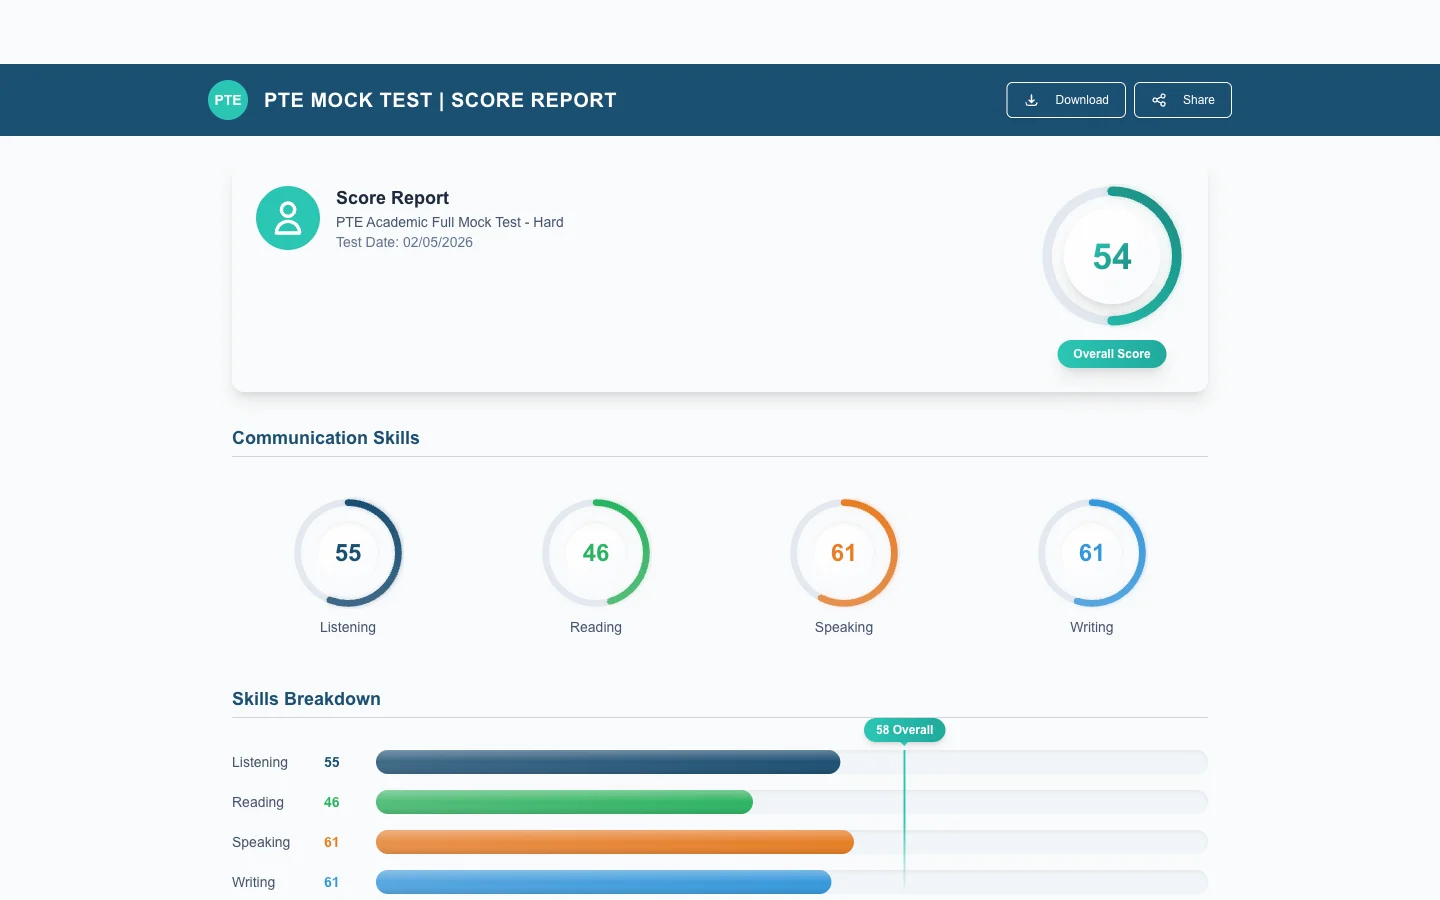
Every completed mock exam generates a multi-page score report. It is built to mirror the real Pearson score report so you can read both with the same vocabulary.
Overall PTE Score
The headline at the top of the report — your 0–90 overall score. This is what universities and immigration departments care about. It is calculated from your four section scores via Pearson's scoring algorithm (not a simple average — Speaking and Writing weight a little differently from Reading and Listening).
Section Scores
- Speaking (0–90)
- Writing (0–90)
- Reading (0–90)
- Listening (0–90)
Each section also shows its contribution to the overall score and a colour-coded band (Beginner / Intermediate / Upper-Intermediate / Advanced / Expert) so you can see at a glance where you sit.
Communicative Skills Breakdown Chart
A radar chart of the six communicative skills — Listening, Reading, Speaking, Writing, plus the cross-cutting "Grammar" and "Vocabulary" skills. This is the diagnostic view: spikes show strengths, dips show what to drill next. For the conceptual model see Communicative Skills Explained.
Enabling Skills
The deeper layer: oral fluency, pronunciation, spelling, written discourse, etc. Same dimensions Pearson reports on the real exam. Use these to design your next two weeks of practice.
Question-by-Question Review
Scroll past the summary and you get every item you attempted, with:
- The question prompt.
- Your response (audio playback for Speaking, text for Writing, selections for Reading / Listening).
- The correct / model answer.
- The score the AI gave each item and which sub-skills it credited.
This is where the real learning happens — not in the headline number.
Download as PDF
The Download PDF button at the top of the report exports the entire summary plus the question-by-question review as a single PDF. Useful for sharing with a coach, reviewing offline, or filing away as a baseline before your exam.
Trends — Compare Across Mocks
The Trends tab plots every mock you have taken on a single chart — overall score and per-section. Two clear visualisations:
- Trajectory: are you trending up, plateauing, or fluctuating?
- Section gaps: is one skill consistently dragging the average down?
If your overall is rising but Speaking is flat, that is the actionable insight — pour the next week into Speaking practice.
Re-Score and Re-Take
If something looks off, see Requesting a Re-Score. To take a fresh mock, see Can I Retake an Exam?.
Open your latest report from the Mock Exam page or jump back to your Dashboard.